
For the Caribbean trip I needed to be able to forecast weather accurately, so that I could position the boat where the weather would cause the least distress to my wife who had never sailed before. Her first sail was 800 miles across the Guld Stream to Bermuds, and the stream can be rough in the wrong weather. The current runs north up to five knots. If the wind is with the current then all is well, but if the wind opposes the current I wouldn’t want to be in the stream.
I wanted her first three days sailing experience to be with light southerly winds.
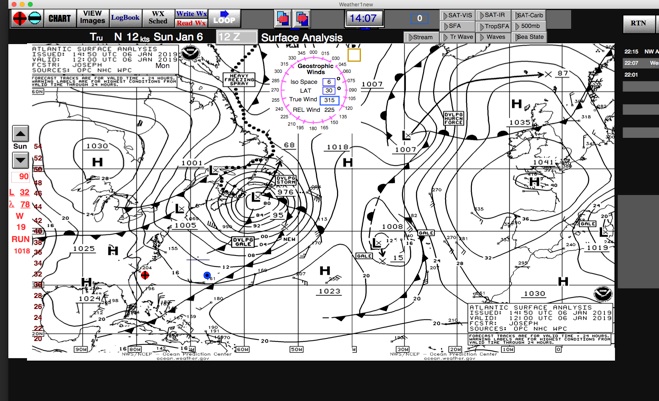
I captured the offcial Noaa weather charts from teh web server and opened them in graphic converter and rotated and copied the images and pasted them in the application. Underneath the picture is a Lat/Long grid and I can place little markers on this to show the boats position now and up to four days ahead. The red dot with a cross in it lower left represents the boat. The blue dot to the right of it represents the waypoint which was Bermuda. I collected up to 12 pictures a day of surface analysis, 48 and 96 hour future predictions, plus the 500 mbar upper atmosphere charts for today, 48 hrs and 96 hrs in the future. Also I captured winds and waves for the same time periods. Then I added a current satellite picture.
By poressing various buttons I can cycle through all the images in the right sequence and watch how the weather would change over four days.
I could then see what conditions of wind and waves the boat might be in if the forecast held, and decide whether that was a good place to put the boat or not. If the weather was going to be adverse at the future points, I could change my course to avoid the adverse weather. Of course each day the forecast changed and I was always able to see four days ahead.
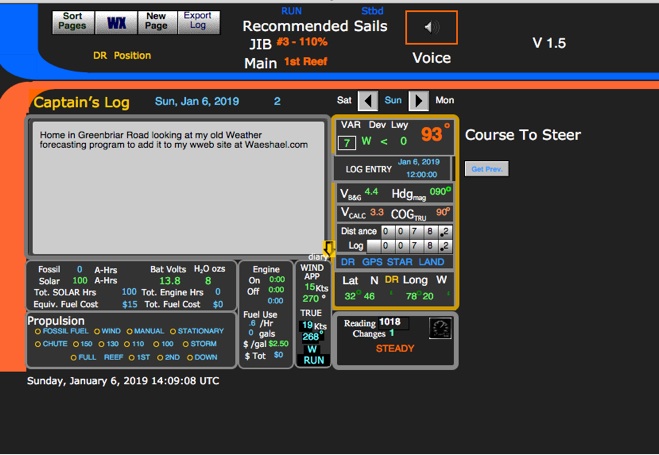
The GPS system helped to correct for any errors in the DR calculations. In any case I had a way of knowing where I was even without any GPS. The beauty of this weather forecasting system is that it uses the real man-made Noaa weather charts that all forecasters use. These are the most accurate predictors of weather. As far as I know there is no other program that enables this.
Most software downloads GRIB files but these are just computer generated pictures—weather forecasters warn you not to use them for anything but around the buoys sailing. GRIB files tell you very little about the possibilities of storm development. For that you must use the 500 millibar charts that show what is happening in the jet stream. In fact the 500 millibar charts are the most important tool for long range planning, such as an ocean crossing. Wx2Go is not available commercially, only I have it. It is way too complicated for ordinary yachties—and it would cost hundreds of dollars because you must have filemaker Pro installed also.
To have a quick look at the most essential pictures to download get this one package which can be sent in email or viewed on the web.
Go to http://www.nws.noaa.gov/om/marine/nwatlanticbrief.shtml for a briefing package showing the next four days of weather on surface and at 500mb pressure level (5250 meters high).
Go to this page for where to download the Weather Book you will need which explains how to read the weather charts.